


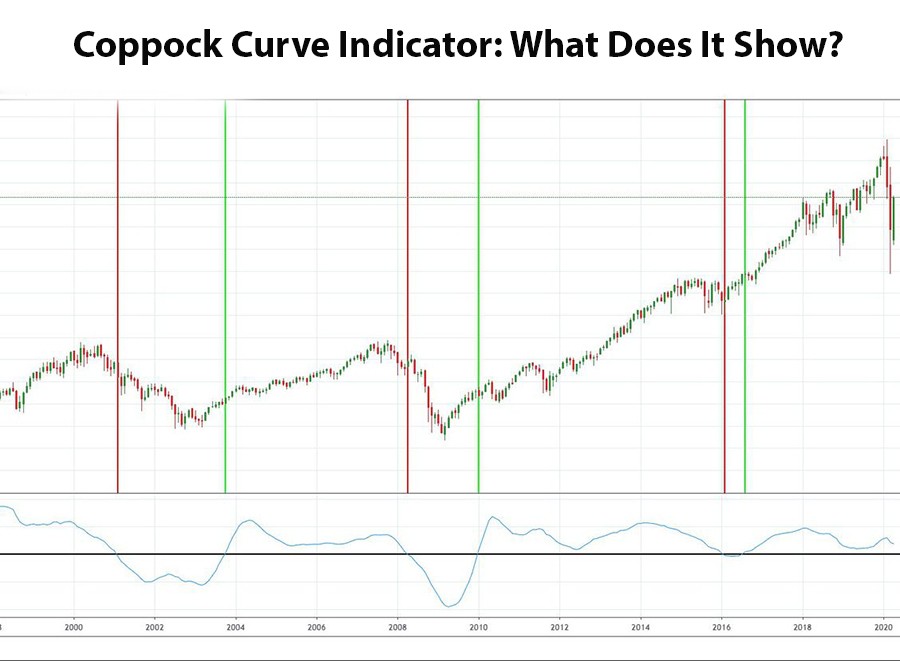
The "Coppock Curve" indicator is a technical analysis tool used to evaluate long-term trends in financial markets. It was developed by Edward Coppock in 1962 and is applied to identify potential reversal points in the market. The indicator is based on a combination of price changes and time, which allows analysts to detect potential periods of bullish sentiment. The "Coppock Curve" is typically used to determine long-term buying opportunities when its value moves into the positive zone, signaling the start of an uptrend.
12/27/2024 3:34:17 PM (GMT+1)
Coppock Curve Indicator: What Does It Show?
This material was prepared by Khachatur Davtyan, developed and translated by artificial intelligence.