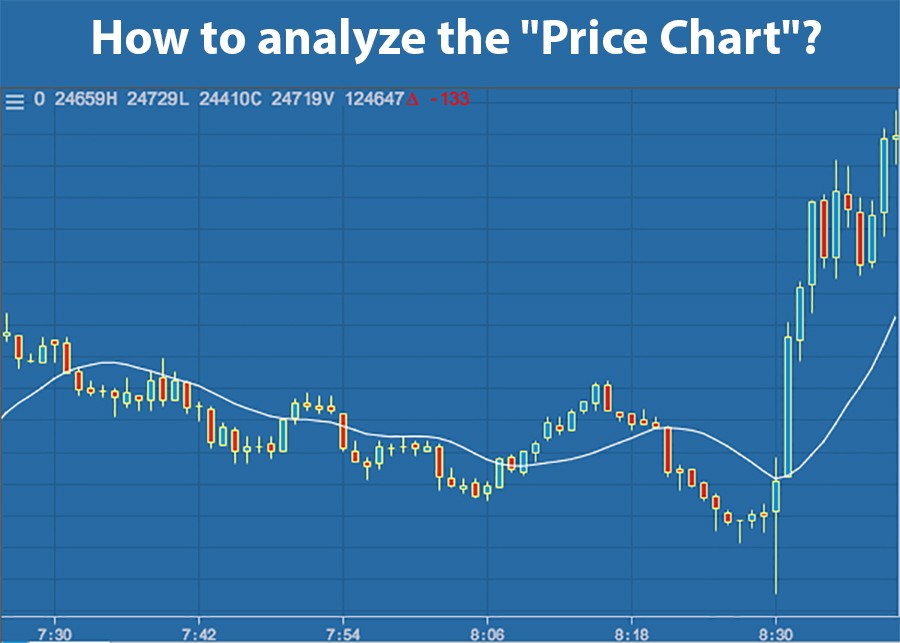
The analysis of price charts is a key tool for successful cryptocurrency trading. This chart shows the price changes of an asset over a specific period of time. It's important to pay attention to trends: upward, downward, or sideways. Using technical indicators, such as Moving Average or RSI, helps predict the further movement of prices. It is also important to study support and resistance levels to identify entry and exit points for trades. Proper chart analysis helps minimize risks and increases the chance of profit.
12/27/2024 3:27:34 PM (GMT+1)
How to analyze the "Price Chart"?

This material was prepared by Khachatur Davtyan, developed and translated by artificial intelligence.

