


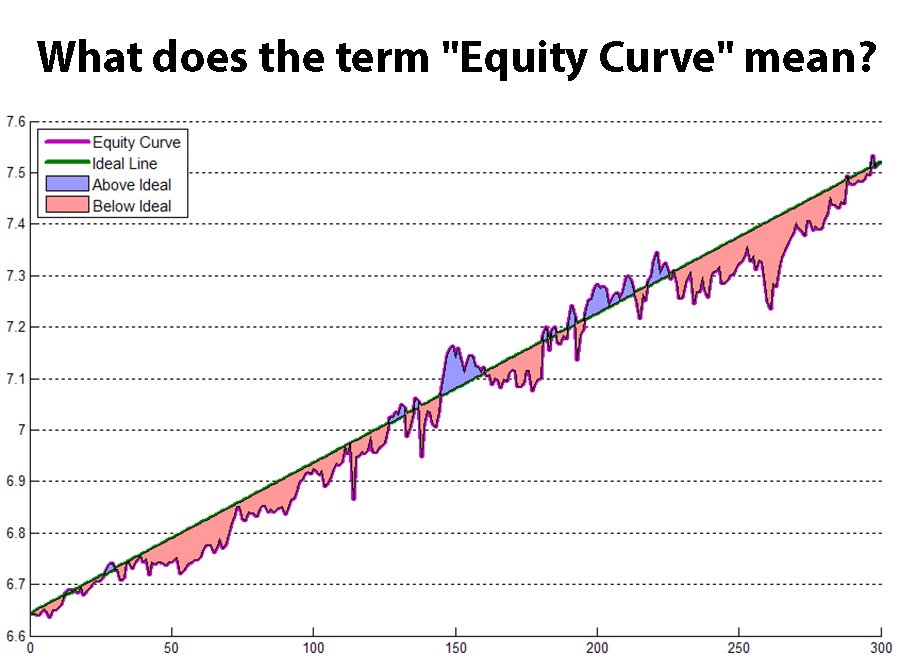
Equity Curve is a graphical representation of the capital dynamics of a trader or investor during trading. It shows changes in the account balance depending on profits and losses over a certain period of time. This graph allows assessing the effectiveness of a trading strategy, identifying moments of maximum losses or profitable periods, and also helps avoid emotional decisions. It is important to monitor the smoothness of the curve: sharp drops may signal risks that require intervention in the strategy.
12/24/2024 3:57:57 PM (GMT+1)
What does the term "Equity Curve" mean?
This material was prepared by Khachatur Davtyan, developed and translated by artificial intelligence.